Pipeline Analytics – Qymatix Sales Analytics Software" use_theme_fonts="yes"]
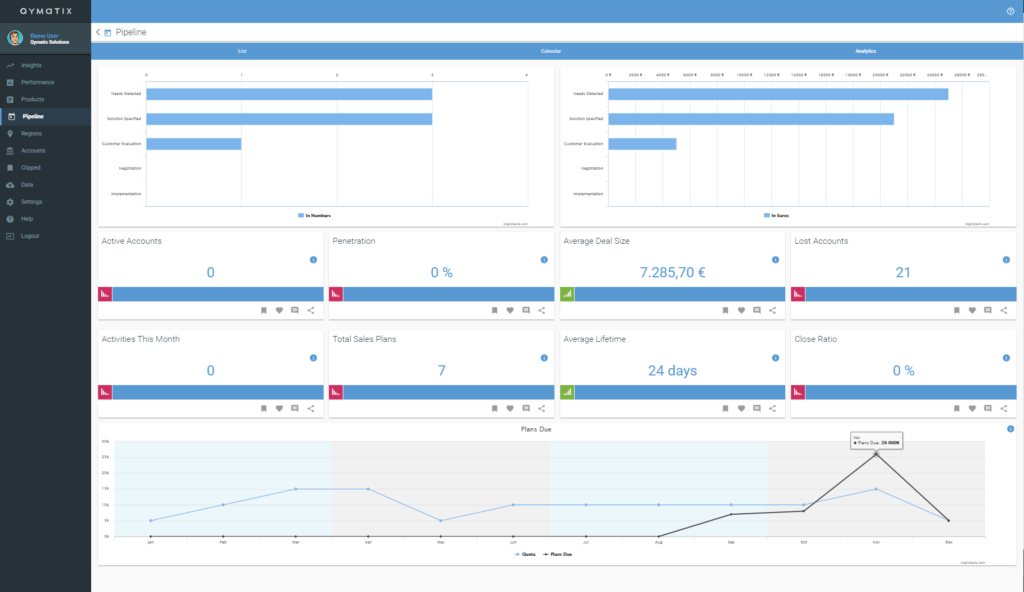
With the sales pipeline analytics view, sales leaders should be able to answer questions such as: how many projects do we have? In which stage are they? What is the potential in euros? Qymatix Expert Tip: To improve the performance of your sales team, focus on the sales plans and activities with better chances of success.
 [vc_custom_heading text="Pipeline analytics KPI
With the sales pipeline analytics view, sales leaders should be able to answer questions such as: how many projects do we have? In which stage are they? What is the potential in euros? Qymatix Expert Tip: To improve the performance of your sales team, focus on the sales plans and activities with better chances of success.
In the pipeline analytics view, you can see the number of deals in your funnel or pipeline, the average size of a contract, their close ratio (or deal win ratio), and their average lifetime (how old your opportunities, leads or opportunities are on average).
Besides, you can compare below the expected incoming orders versus your sales targets. Knowing where you stand compared with your goals extremely beneficial.
Remember that if you have precise information about the sales cycle and its length, you now have tremendous insight on how to plan your upcoming sales quarters and how to give specific guidance to your salespeople.
Moreover, once your sales planning process becomes evident, you can start to create a predictable sales pipeline and revenue stream for your organisation. Invest your time wisely and pay attention to those accounts that can yield the best results.
This online manual reflects the functionality of Qymatix Predictive Sales SaaS version 0.5.0. Variations may occur with more advanced versions of the tool.