Sales Reporting – Qymatix Sales Analytics Software" use_theme_fonts="yes"]
Reporting Sales is one of the most common tasks of a sales manager. It involves selecting and reviving a set of pre-defined Sales KPI.In the Qymatix Sales Analytics Software, the view of Sales Reporting is the one dedicated to past information. If the Sales Insights show you what is possible, the view Sales Reporting shows you what was possible.
Qymatix Expert Tip: Get a basic understanding of the value each key account manager provides.By analysing sales data in this view, a sales leader can understand the effectiveness and efficiency of his team’s actions and sales plans. The Sales Reporting view has three tabs: total, per Key Account Manager and customer.
[vc_custom_heading text="Sales Reporting Main View
Reporting Sales is one of the most common tasks of a sales manager. It involves selecting and reviving a set of pre-defined Sales KPI.In the Qymatix Sales Analytics Software, the view of Sales Reporting is the one dedicated to past information. If the Sales Insights show you what is possible, the view Sales Reporting shows you what was possible.
Qymatix Expert Tip: Get a basic understanding of the value each key account manager provides.By analysing sales data in this view, a sales leader can understand the effectiveness and efficiency of his team’s actions and sales plans. The Sales Reporting view has three tabs: total, per Key Account Manager and customer.
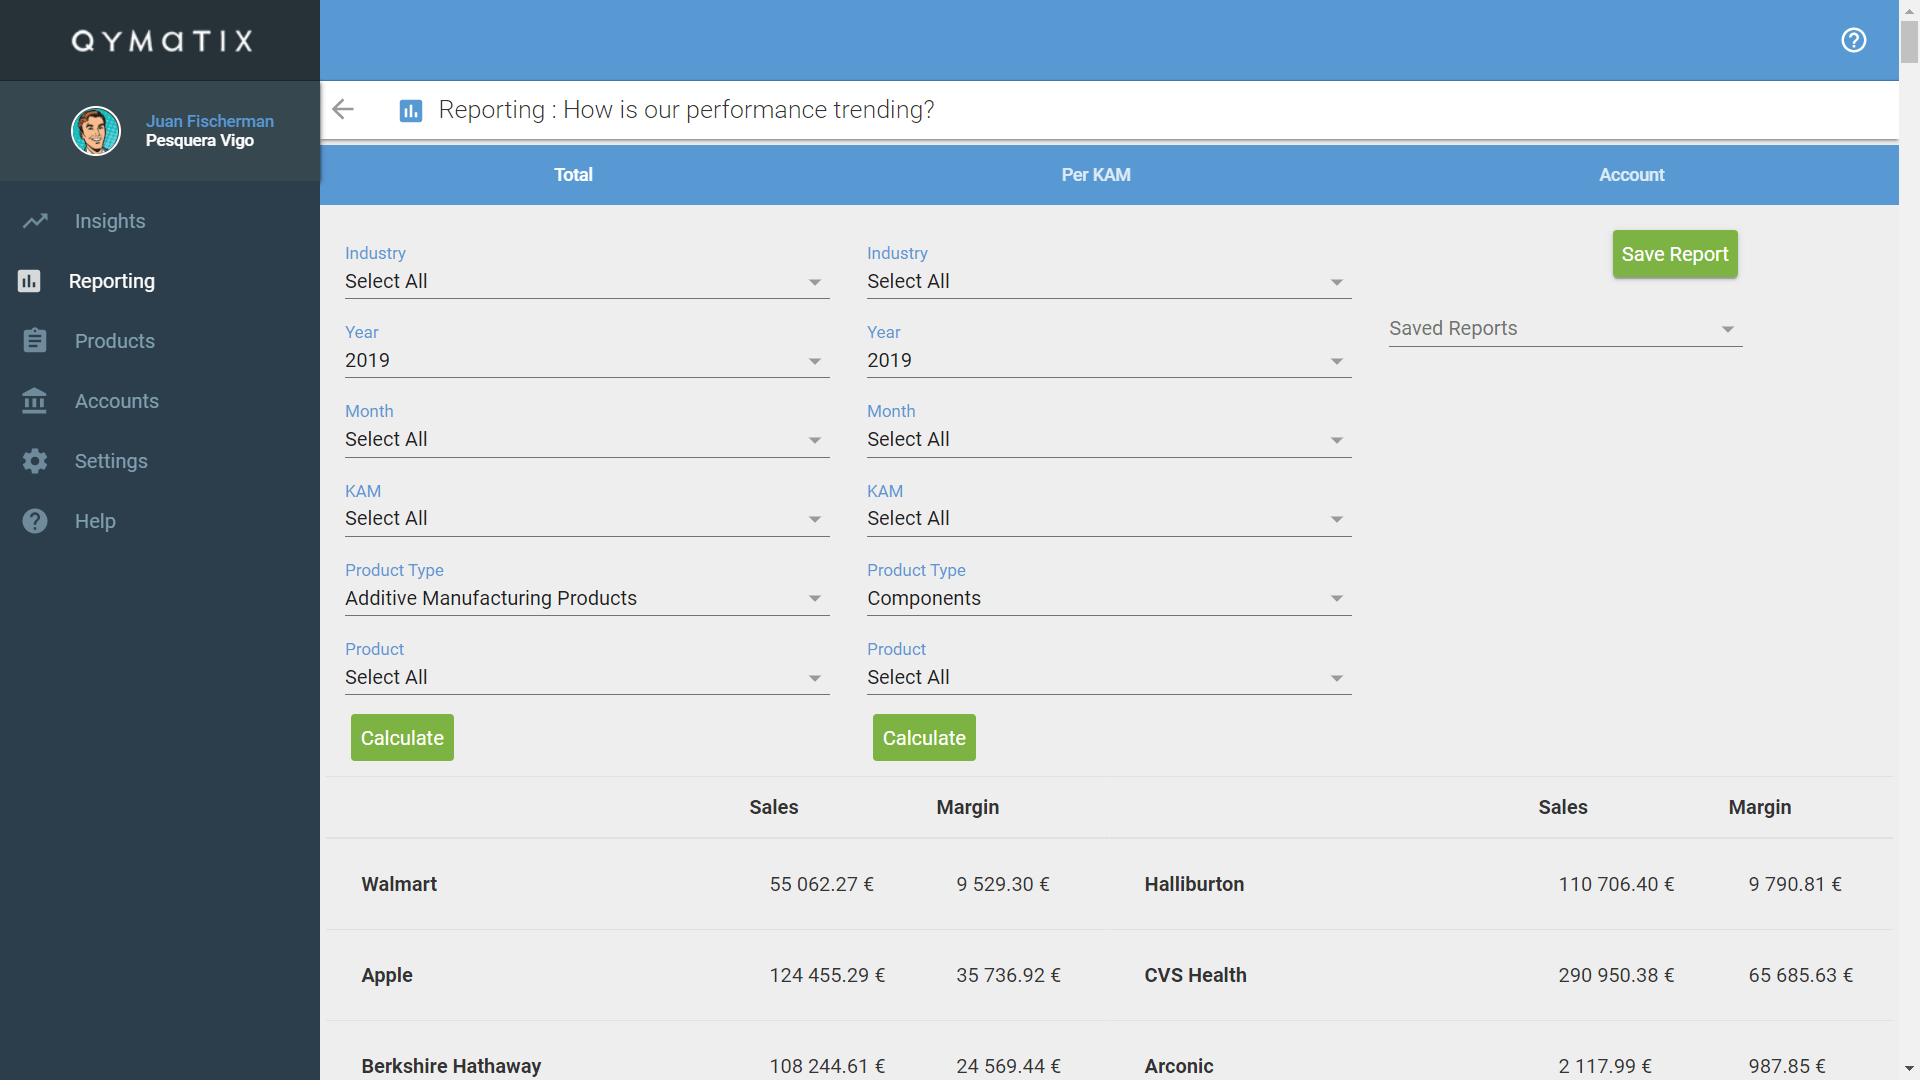
In the total tab, you can select two sets of filters to perform and compare the past performance of your customers and sales team. You can choose period, years, months, product or articles, product types and Key Account Managers. You can save your reports to access them later.
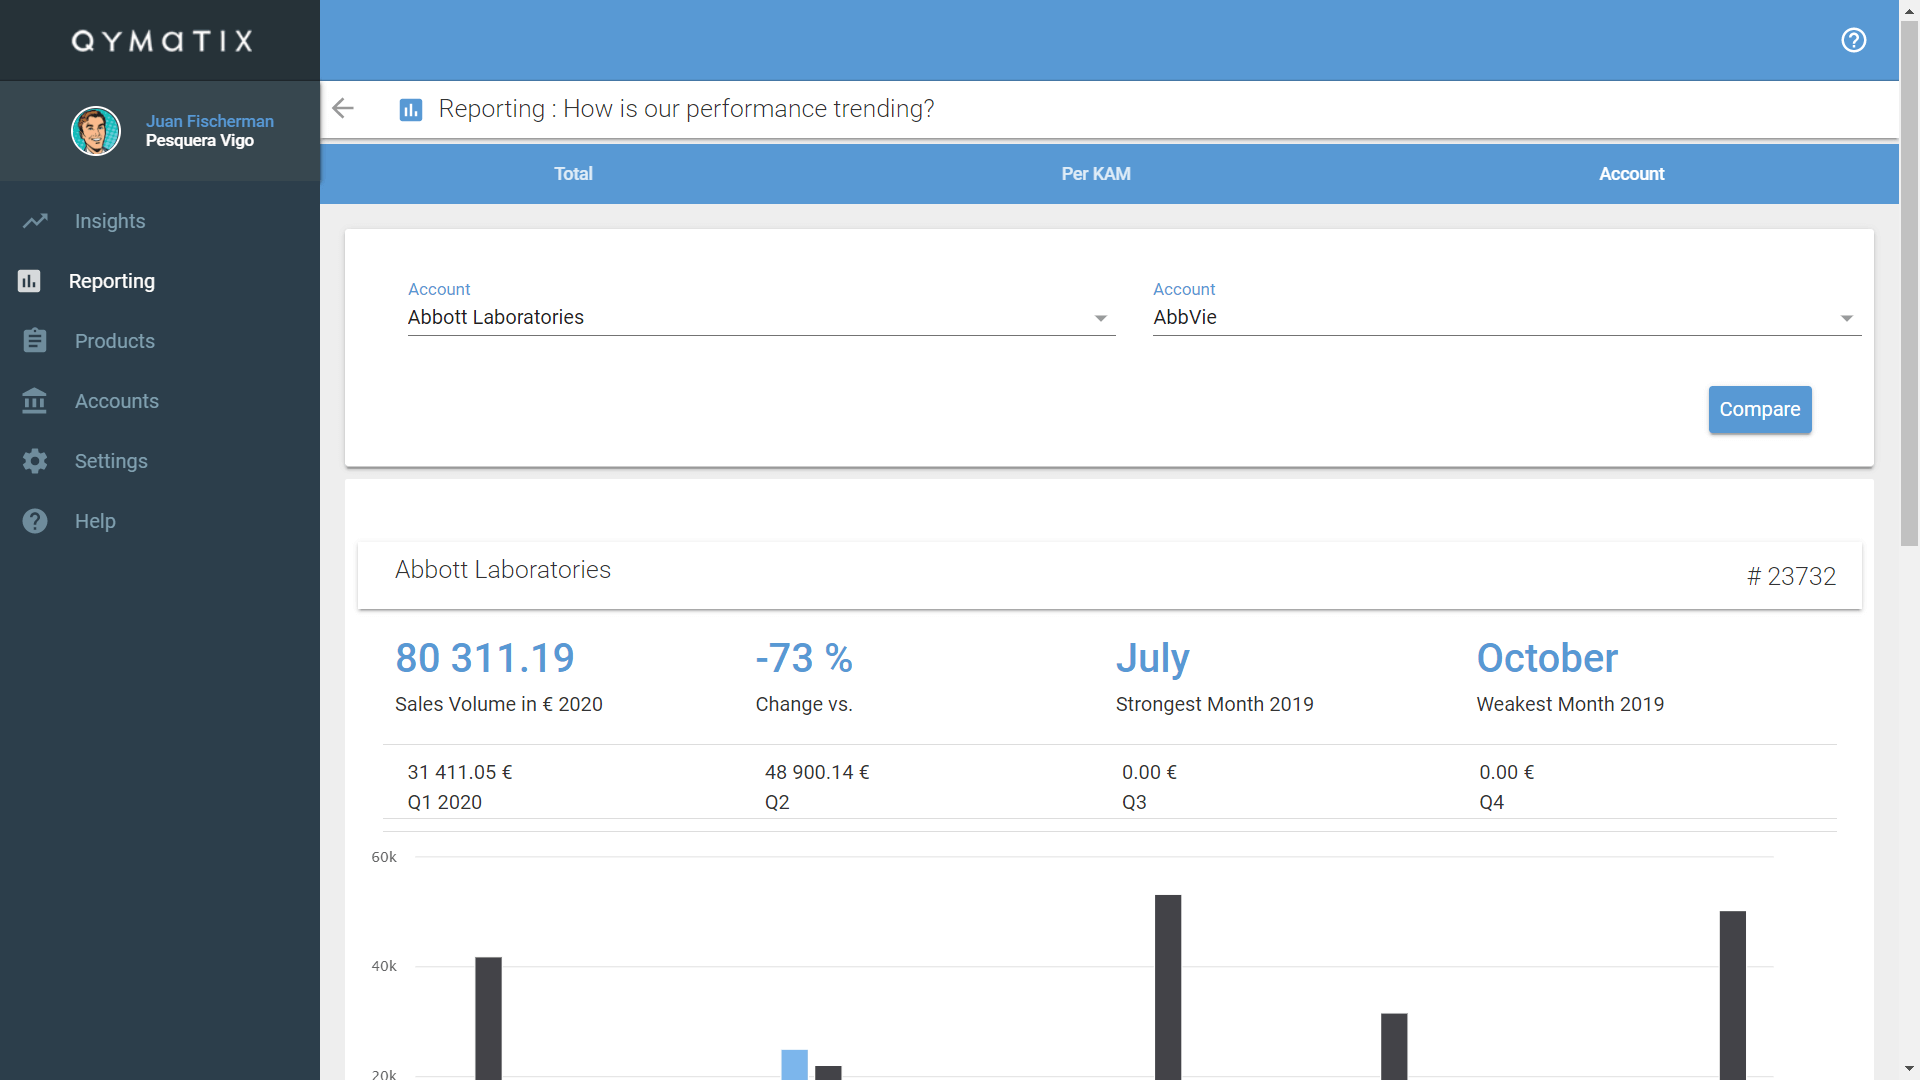
Reporting Sales per KAM (Key Account Manager) and comparing accounts.
In the KAM tab, you will access a summary of selected standard Sales KPIs of your sales team. Use this tab to get a discussing going quickly but do not overestimate the comparisons. Finally, in the Customer tab of the Sales Reporting view, you can immediately access and compare a summary of selected standard Sales KPIs of your active customers.
Remember that only some user’s plans have access to this view and that the information you can access will depend on your user type.
This online manual reflects the functionality of Qymatix Predictive Sales SaaS version 0.5.0. Variations may occur with more advanced versions of the tool.