Sales Insights
One of the most important tasks of a sales leader is to provide their sales team with specific pieces of valuable information; what we call “sales insights”.
Qymatix Expert Tip: Studies have found that sales leaders who focus on activities with better chances of influencing sales results, could improve the financial performance of a company by more than 15%.
Sales insights are the result of advanced sales analytics that can help your team to sell more, find hidden opportunities or avoid customer churn.
With this view, Qymatix will help you answer some of the following business questions:
– What are the current sales and margins trends?
– Where do we have quick-wins and opportunities?
– Which customers have unfulfilled cross- and up-selling potential?
– Which recurrent buyers are at risk of not buying again?
– Where do we have inconsistencies in our pricing strategy?
– Are we allocating our resources in an optimal way?
– Which sales plans have better chances of succeeding?
How does Qymatix get those sales insights? Once Qymatix has access to your Enterprise Resource Planning System (ERP), or a list of your past sales transactions, a set of advanced data mining algorithms will dig into your data for you and come up with results you can understand and communicate.
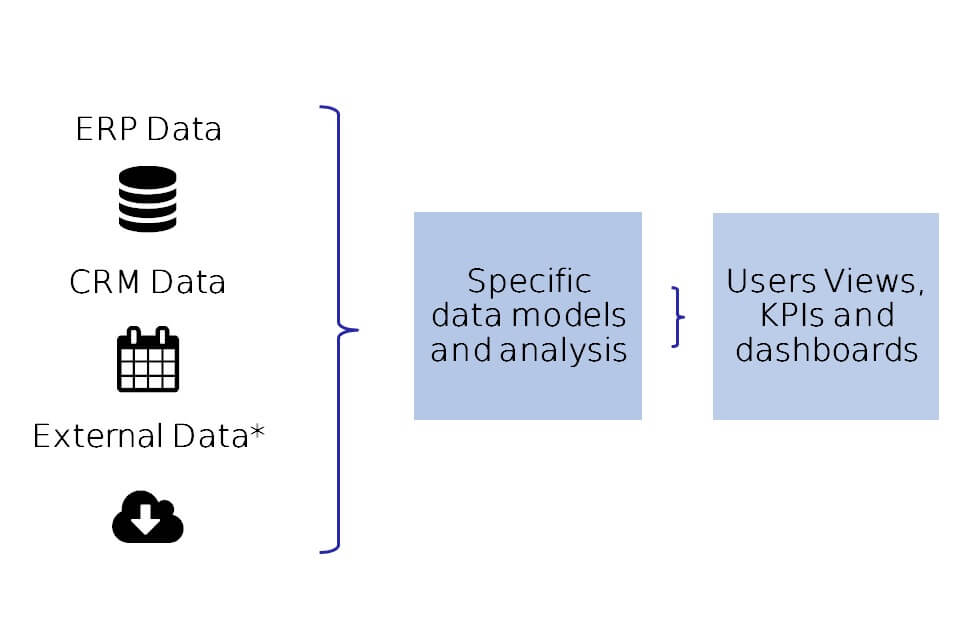
To answer these sales analytics questions, a sales leader should work in three layers: the main question, a list of customers and a deep insight into each customer. We structured our sales insights view in exactly that way: the main analytics view, a customer list layer and a customer details layer.
Qymatix Expert Tip: Remember, when it comes to analysing data, less is more. That is why this first view focuses on the main six sales insights a sales manager in B2B needs.
Once you have uploaded or connected your ERP sales data, you will see the results of six main data analyses: total sales and trend, total margin and trend, potential, customers at risk or churning, pricing analytics and sales plans. In our advanced version, you can share, comment, like or mark each of these KPI cards.
Total Sales and Total Margin represents the sum of all products sold during the last year. You can also see the total per month, a monthly rolling forecast. You can compare it with the past year.
The third car summarises the buying potential of this customer. This analysis is performed using an advanced arithmetical ad-hoc clustering function combined with a market-basket analysis. Using the result of this algorithm, you can quickly understand which customers can buy more, or have more cross- and up-selling buying potential. As with any of these six cards, if you click on it, you will access a list of the customers ordered by potential. Why is this function useful? Because assuming you have limited sales resources, it is a sensible idea to focus your first actions on those customers with higher buying potential.
Qymatix Expert Tip: focus your sales actions in those customers with higher buying potential.
Similarly, using an advanced predictive analytics function, Qymatix can point you to the customers with a higher probability of not buying again in the following period. This mathematical function called ‘churn risk’ (or customer attrition risk) is useful for starting to dig deeper into the client’s relationship. It is also represented using colours, where red means a higher probability of risk. Why is the function useful? Because if you undertake some specific actions, you can avoid the customer from churning.
Qymatix Pricing Analytics is an advanced tool that analyses the buying behaviour of your customers and is useful to understand where you might not be offering optimal prices. The three bars on the card group the entire historical sales transactions per customer, and order them into ‘bad’, ‘normal’ and ‘good’, according to the prices they have paid, compared to the total average price paid by the rest of the customers.
Why is this function useful? Because you can, in one click, access a list of your accounts based on pricing analytics.
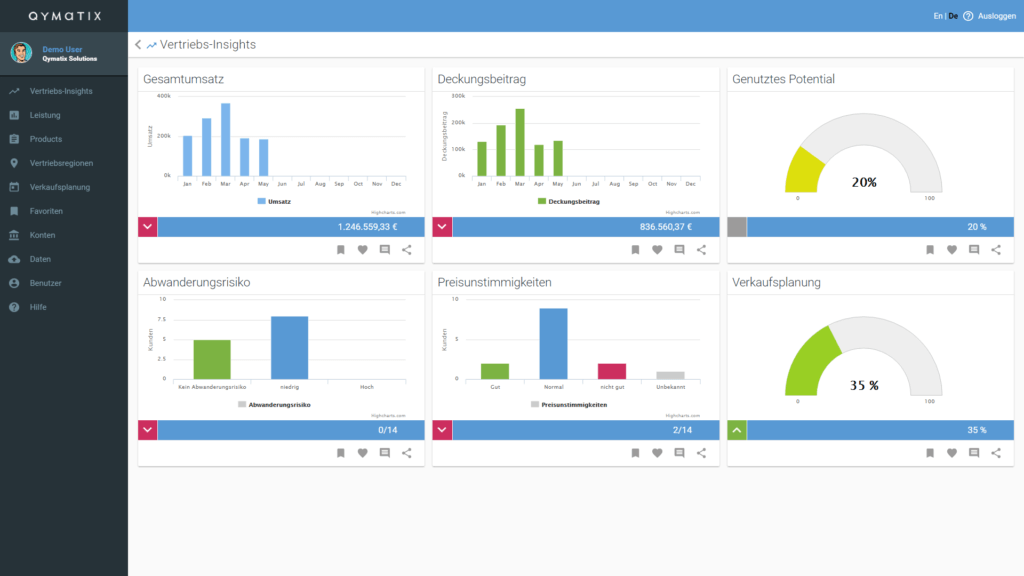
Last but not least, in the first overview, you can also compare the volume in euros of sales plans currently open for your team’s customers versus the estimated potential. Have your sales team found the sales potential it should?
This overview helps you to answer that question. If you click on the card, you will navigate to the analytics tab of your pipeline view. There you will be able to analyse your sales activities in detail.