Market Basket Analysis in Excel – Example for Cross-Selling in B2B

Please enter your Email address
One Useful Example of Predictive Sales Analytics Using Excel
Cross-selling is the practice of selling an additional product or service to an existing customer. Indeed, B2B companies define cross-selling in general and cross-selling analytics in particular, in many ways and with many names. One common naming used in retail or distribution is “market-basket-analytics”.
Most of us are familiar with cross-selling from our experience as online consumers. “Customers that bought X also bought Y” or “related products”. E-commerce websites make product suggestions based on a market basket analysis. The list of the possible suggestions is also known as “associating rules”. Marketing practitioners talk about “Buying Propensity”.
Regardless of its name, cross-selling is a well-known sales strategy in B2B, where the cost of acquiring new business is usually significantly higher than selling one additional product to an existing customer.
Therefore, implementing a cross-selling strategy can represent a financially attractive investment if a company can effectively find ample cross-selling opportunities.
Let’s see how you can perform this kind of analytics using MS Excel.
One useful example of Cross-Selling in B2B using Excel – The short story.
This article describes a step by step introduction to market basket analysis using Excel. Here where you can learn to determine association rules from the list of sales transactions from your ERP system.
Let us disclosure that our software uses a couple of data mining methods to present users with timely cross-selling opportunities. Based on these data mining algorithms and techniques, we would like to discuss here how any sales executive can find cross-selling opportunities using excel.
We want to present a useful and readable example, and therefore, we will skip most of the detailed mathematical explanations. Contact us if you want to know more about them or if you want to test our software.
I want to learn how to perform a market basket analysis in excel.
How do you get data analysis in Excel? The first step: prepare your data.
In this example, a sales manager needs to download to excel a list of past transactions from an ERP System.
Consider the following picture as one of many possible templates.
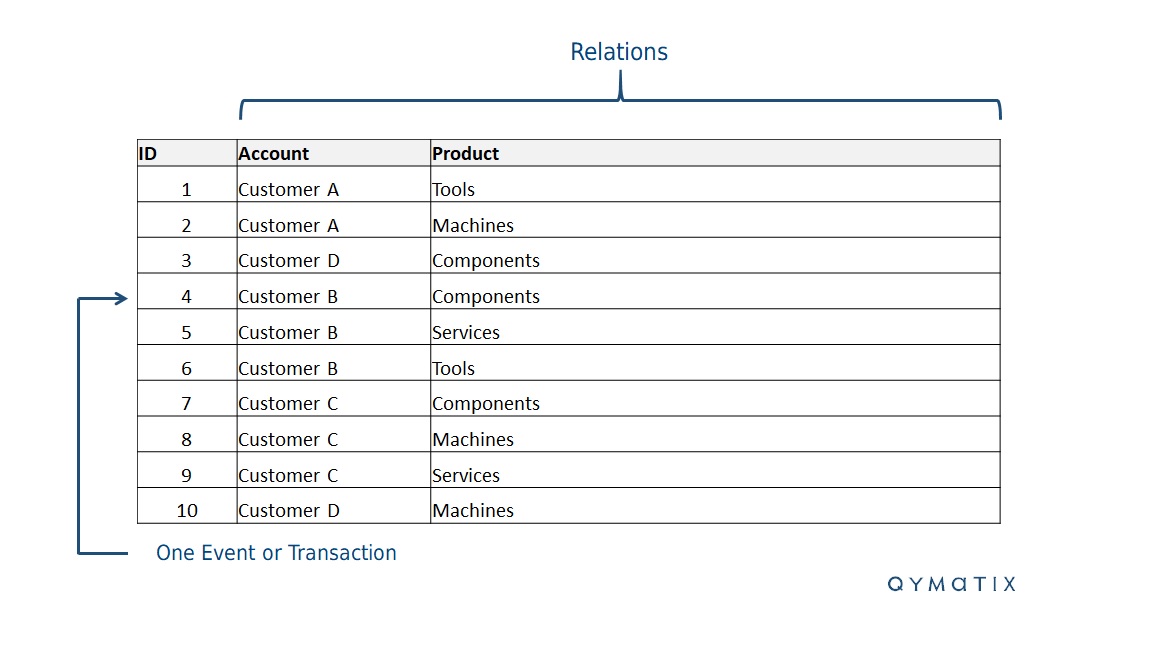
Now, as with any data analysis venture, spare a moment to define and improve the quality of your sales data. This step involves making assumptions and settling trade-offs.
You can select or filter over a relevant time range or a subset of customer or products. You can even decide to omit from the analysis sales transactions that fall outside a “normal” range. Think of these as “outliers” or unreliable data.
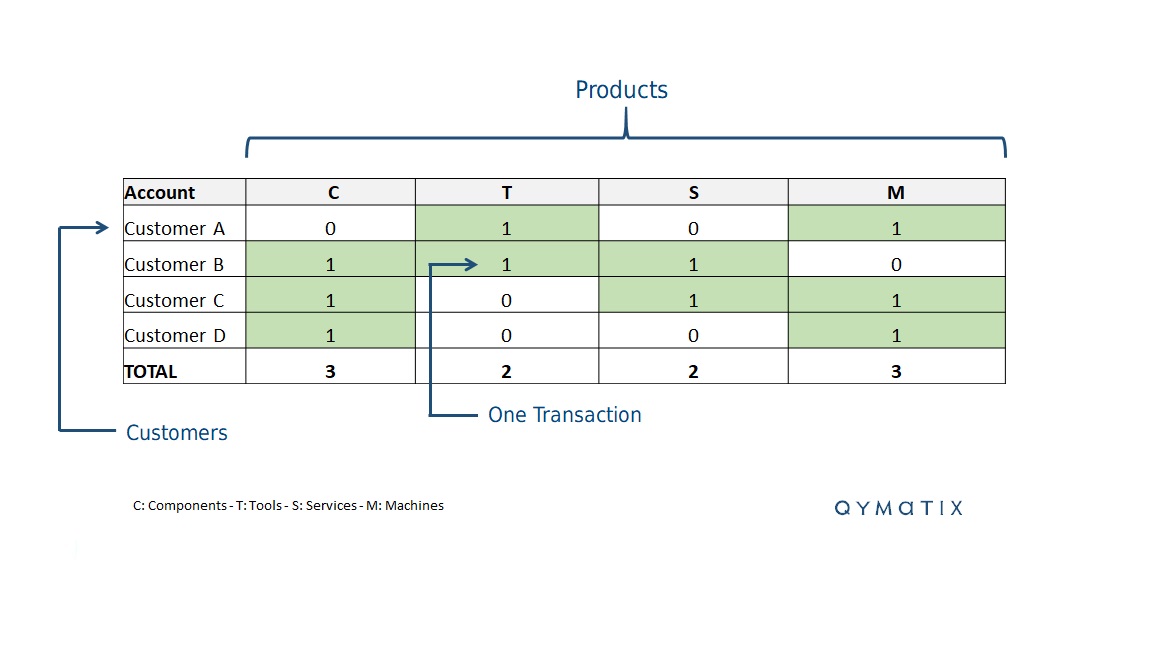
To apply the predictive analytics method that we will present here, you will need to group your transactions in a format usually known as “binary data”.
For example, using again our image above, list the customers as rows and the products as columns and put a number “1” into the events or transactions downloaded from your ERP.
Going back to our Excel example, you should end with a table like the one in the figure below. Note that we replaced the name of the products with each first character (C: Components; T: Tools; S: Services; and M: Machines).
Use an apriori algorithm to find cross-selling with predictive analytics.
What you have built already is a binary transactional database. Now you need an algorithm to mine through it and find association rules. Apriori makes exactly that.
Apriori is an algorithm for association rule learning and frequent itemset mining over transactional databases. It identifies the standard individual products in the database and predicts where else they could appear. In simple words, apriori answers the question: “who else could buy product C?”.
This data mining algorithm works by weighting the occurrence of all possible association rules. Association rules are all possible product combinations. The figure of possible combinations can be a huge number if you have thousands of products.
The total number of possible association rules, R, is exponential to the number of items, n, according to the formula below:
R = 3 n – 2(n+1) – 1
In our example, with four products only (C, T, S, and M), we will have fifty different association rules. For simplicity, we will not list them all here. Of course, to implement an apriori with excel, you will have to record them all.
Create a column in excel by listing all possible buying combinations. For example, create a column X and a column Y and place the first C,T; C,S; C,M. This table will look like the one below.
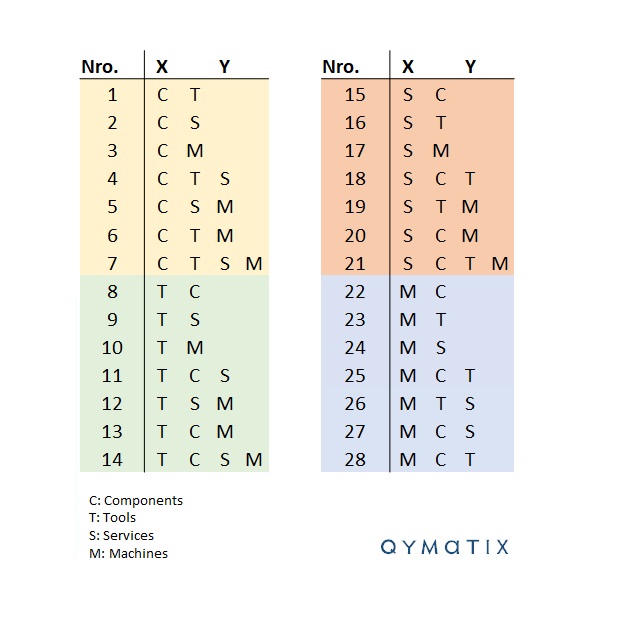
It is essential to note that association does not imply causality. An association amongst products is the measure of co-occurrence and does not represent cause and effect.
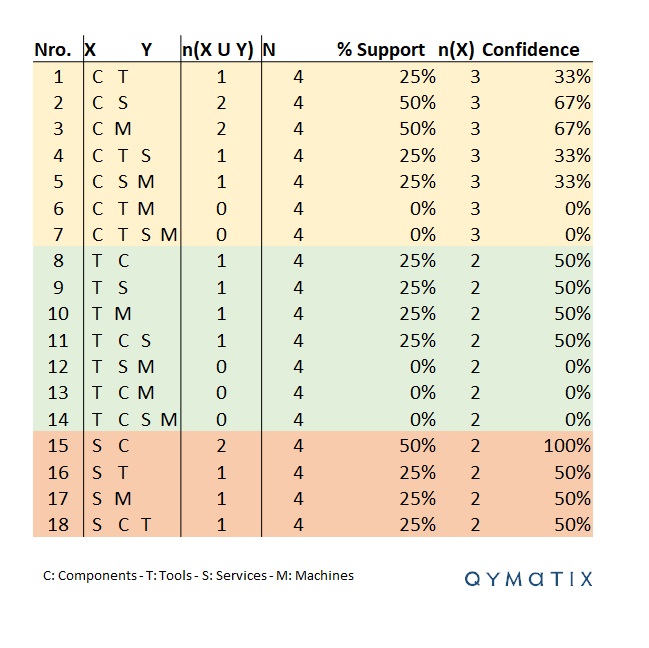
To learn from your association rules, you need to add support and confidence. The support denotes the frequency of the rule within your transaction dataset. A high value means that the product combination happens often.
The confidence of each rule represents the percentage of transactions containing product C, which also include product M. This calculation represents an estimation of conditioned probability.
Now we need to calculate both support and confidence for each of the association rules. In our example, one could make this for each of the 50 rules (or at least for the rules that are present in the transaction database). One can do this using the “binary data” prepared in the previous step.
We will not get into details. You can quickly calculate the number of occurrences n(X U Y) using a nested SUMIF and count the n(X) by looking a the totals of the binary data. N is the total number of transactions, in our example 4. Once you did this, calculate the support as n(X U Y) / N and the confidence as n(X U Y)/ n(X).
Having done this, you will end up with a table looking like the one below.
Effective cross-selling strategy? Filter the rules with high support and confidence.
Now, looking at the image above, you can filter by two thresholds: minim support and minimum confidence. Since we only have four transactions in our example, there is a limited number of options. For instance, take the minimum support of 50% and minimum confidence of 70 %. You will find one rule only satisfying this condition, the rule number 15: S – C.
When mining for associations rules with cross-selling algorithms, data scientists usually find three categories of rules: trivial rules, inexplicable rules and actionable rules.
Trivial rules are combinations that are obvious and well-known. For example, if a customer buys a big machine, it might undoubtedly need services. Knowing that the algorithm confirms such a rule usually adds no value.
Inexplicable rules are those we cannot explain and add no value either. There is no way to prepare an offer or a cross-selling strategy if the association rules make no sense at all. This situation often happens in data mining. As a general law, always let your salespeople review the possible cross-selling rules before trying to take action on them.
The most valuable discoveries or insights are the actionable rules. These are insights a sales team can use, for example, by creating a targeted marketing campaign or by preparing special offers only for the customers with the highest likelihood of accepting them.
In our case, the association rule S – C (Services – Components) might well be actionable. If a customer is buying services, offer them components (i.e. Customer D on our database). In other words, a company can prepare a targeted offer for parts only to customers buying services and so they will save time and money.
CALCULATE NOW THE ROI OF QYMATIX PREDICTIVE SALES SOFTWARE
Data mining techniques to improve sales? Let the machine learn.
What is the next step? First, our example only used four transactions and four products. This limited number of products and deals is usually not the case in B2B, where manufacturers or distributors handle with hundreds or thousands of customers and products. In such a situation, the computation of an apriori algorithm should use other techniques and can be automated.
Afterwards, one can extend this analysis to all products, transactions and customers of your ERP database. Using an apriori algorithm across all sales will unearth a few new cases of undiscovered buying propensity.
Using this score, a sales leader can rank customers and products and develop cross-selling strategies for those at the top. The complete analysis could be summarised and measured using a form of predictive KPI. Successful companies base their predictive KPIs on predictive models that enable the scoring of customers.
Selecting this form of predictive KPI, a sales leader can dig deeper and score customers according to their buying propensity only in a designated segment, for example, a given sales region. The goal is to target a share of customers in the top range of the score allowing to discover an optimum of potential buyers, instead of targeting a random selection of clients.
Once the first step is completed, a system can be automatized, feeding it regularly with increasing numbers of ERP transactions. Besides, once the algorithm has learned the first rules, the minimum support and minimum confidence can be automatically adjusted, enabling an early case of machine learning.
One Useful Example of Predictive Sales Analytics Using Excel – Conclusion:
Predictive sales analytics uses a collection of data mining methods to describe and predict the likelihood of future outcomes. One useful application of predictive sales analytics is cross-selling or market basket analysis.
Excel is a popular software for sales analytics and reporting. With some time and basic knowledge of data mining, a sales leader can, for example, successfully prioritise customers by cross-selling potential using Excel. There are alternatives to Excel for predictive analytics.
In this article, we introduced some basic concepts of market basket analysis using an Apriori algorithm. Apriori is used in data mining to discover association rules over transactional databases; for example, sales transactions from an ERP system.
In statistical terms, Apriori works by identifying the frequency of individual items in the database and applying this frequency to bigger datasets. The more frequent customers buy some products together, the higher the likelihood they will be rebought.
With this calculation, a sales manager can create targeted offers of specific products that have a better chance of being accepted by defined customers.
I need a market basket analysis today – excel or not!
Free eBook for download: How To Get Started With Predictive Sales Analytics – Methods, data and practical ideas
Predictive analytics is the technology that enables a look into the future. What data do you need? How do you get started with predictive analytics? What methods can you use?
Download the free eBook now.
- We will use this data only to contact you for discussing predictive sales KPIs. You can read here our declaration on data protection.
Also interesting:
Are you a sales manager with Big Data? Here are three Predictive Analytics examples for B2B
Further Read:
Tan, P., Steinbach, M. and Kumar, V. (2013) Introduction to Data Mining.
Association rule learning – Wikipedia
Header Image: “The Calling of Saint Matthew”, photo of art work made by Paul Hermans. [Public domain], via Wikimedia Commons

