Build a Price Corridor using B2B Pricing Analytics – Example

Please enter your Email address
Pricing Analytics in B2B: The Price Corridor.
Pricing policy decisions are of enormous importance for companies due to their straight impact on profits.
However, the targeted and systematic design of price management poses considerable challenges for companies in many different industries. This article gives an overview of one fundamental tool for price analytics: the price corridor.
Pricing analytics has a remarkable effect on business earnings. An average 5 % increment in pricing can drive profits up by 50 % on a regular business. The same improvement on fixed costs, variable costs or sales volume would change earnings by 15, 20 and 30 % correspondingly.
One simple fact. Getting the price right has a more significant impact on profits than increasing sales volumes or reducing costs. This understandable true is the reason behind most B2B pricing strategies. Companies can only implement winning pricing strategies with the help of pricing analytics.
Pricing analytics in Business-to-Business should help sales teams to set an optimal price for each customer and product. Sales leaders can analyse and determine the optimal price levels across thousands of sales transactions using a price corridor.
A price corridor is an extravagant name for a price analysis visualisation in which a company compares the price level of its products and customers. It is an essential instrument of international pricing. Let’s see how to use a price corridor in B2B.
Price Corridor Analysis: range between target and limit prices for operational pricing
What is a price corridor? A price corridor is a fancy name for a stepped price segmentation: customers buying higher volumes getting lower prices. Depending on discounts and incentives, this stepped segmentation will look like a corridor.
To perform this kind of pricing analytics all discounts and bonuses should be explicitly allocated by product or product group. Customers might also need to be grouped, for example by regions or type. Transport, freight costs and taxes should be flatted out.
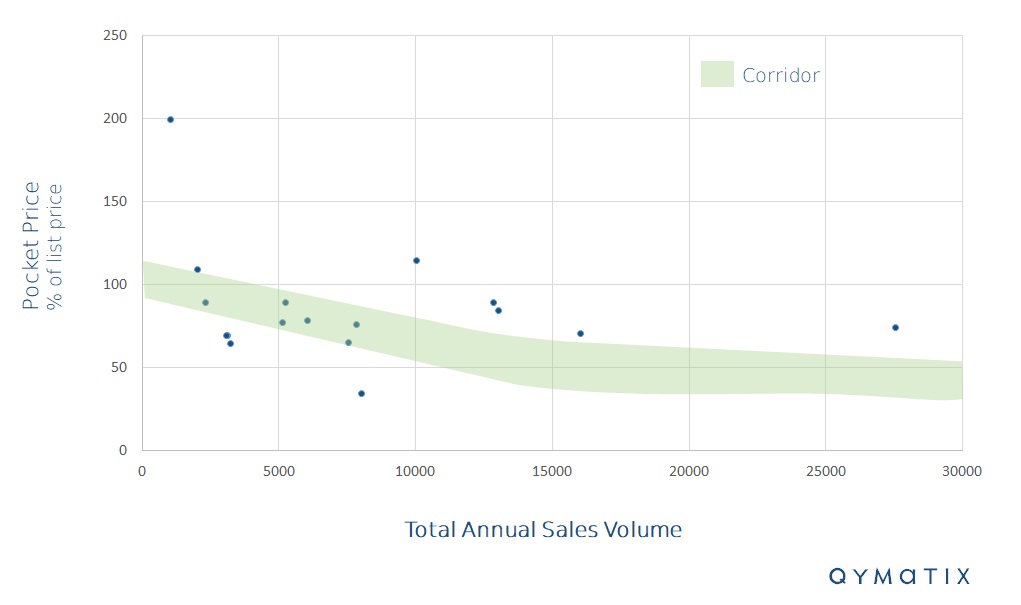
Once you have taken these difficulties into account, compare the relative final price each customer is paying for a product or product group with the volume they are ordering. You can take the list price of a product as the 100 % scale in the vertical axis. If a customer pays different prices for the same product, you can use a weighted average. You should end up with an image like the one below. The blue points represent customers.

In the image above, we used a 5 % deviation from the expected price levels in the corridor. The green area between the upper and the lower level are the price corridor itself. Each point represents the price one specific customer is paying – also known as price pocket.
Customers within the corridor have an acceptable relationship between conditions granted and annual sales and do not require any action. For customers outside the green band, the conditions given here are too large concerning revenues and the sales team should negotiate.
Help me to build a Price Corridor with Pricing Analytics.
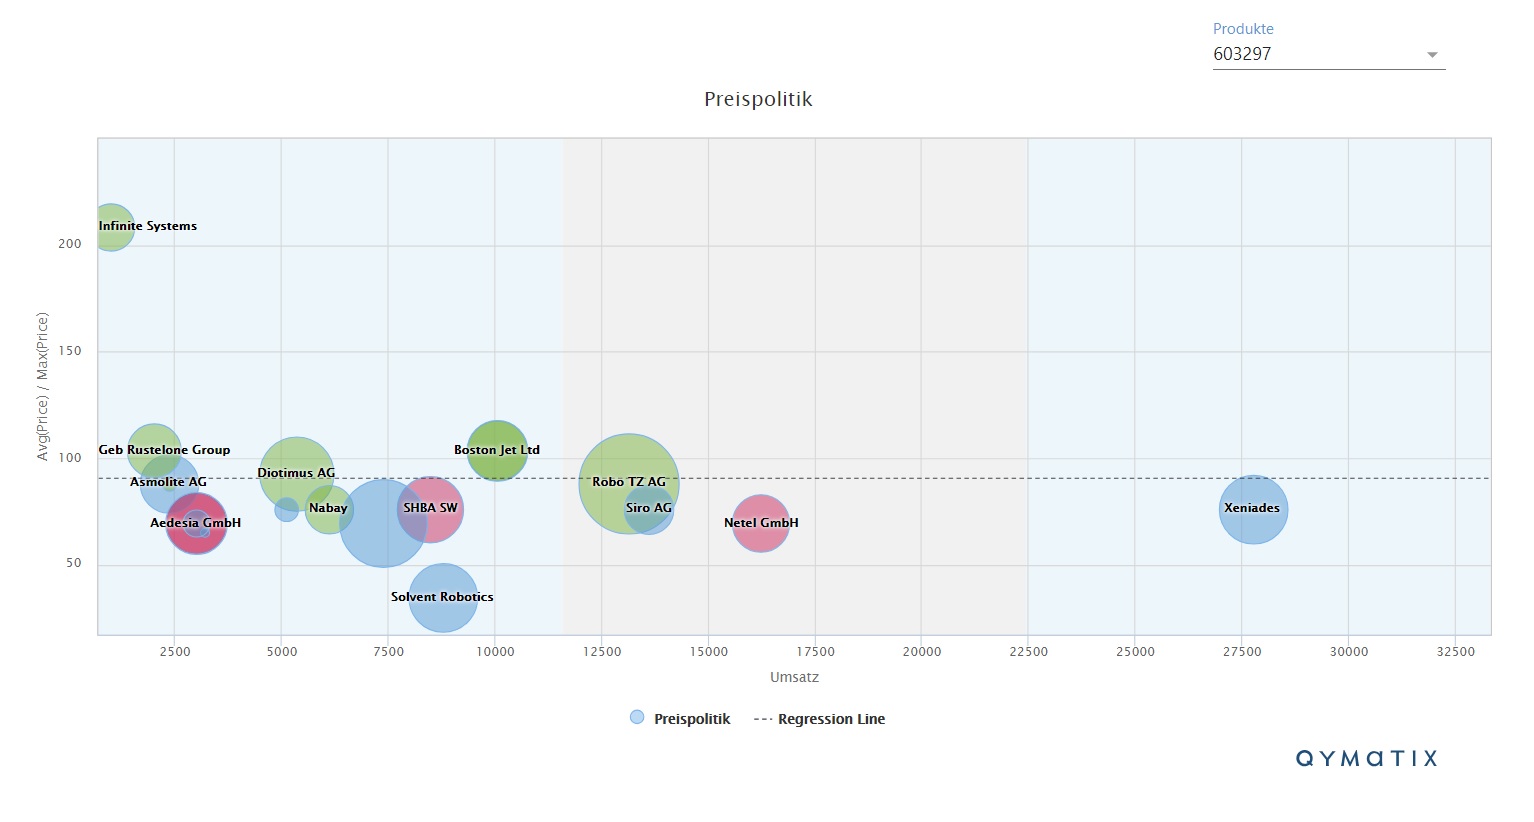
You can add more information to the analysis. For example, you could use the total revenue (for all products) of each customer. Employ this data as the size of the circle thus adding a third axis.
Furthermore, using advanced pricing analytics, you could cluster customers regarding the average price levels they pay across your entire product portfolio.
For instance, you could add colours red, blue and green, to discriminate the overall pricing levels each customer pays. This segmentation will add valuable extra information to your analysis.
Also, what happens if you do not have a unique price list? In that case, you could use the weighted price average as the 100 % level of your “hypothetical list price”.
Moreover, instead of just drawing an upper and a lower level, you could calculate a linear regression crosswise the weighted average prices. This algorithm offers a closer look to the “real” corridor compared with the manual 5 % divergence we used before.
Allow us to present the result of this analysis using our pricing analytics software as shown below.

Price management using your price corridor analysis.
Creating a pricing corridor is a simple yet powerful concept in pricing strategy. It offers valuable information about the present standing regarding pricing for all customers and products.
This level of detailed analysis allows sales leaders to set final pricing targets by accounts. Furthermore, it helps them to quickly recognise problematic prices and prevent spurious prices in the long run.
How to accurately use the price corridor analysis? Instead of setting prices without discrimination of volumes or conditions you can target fairer prices with more significant customers. Just look for situations outside of the price corridor. Prioritizing will save you valuable time and effort.
Once you have identified a problematic price situation, you need to act. Reconstruct the conditions that arrived at the price level and analyse where you can re-negotiate. Having further information about the customer, such as its usual “price-behaviour” will help you understand if this is an isolated case or if you need to lead a broader negotiation.
Lastly, remember that small improvements in prices can have enormous implications for your profits and the customer lifetime value.
Build a Price Corridor using B2B Pricing Analytics – Summary.
Regardless of the type of pricing strategy in your business plan, you will need to control and analyse it. Controlling pricing requires an understanding of the price levels your customers are paying. If your company has thousands of produces and customers pricing analytics can become a significant challenge.
Sales managers use price analytics to determine the optimal price for each customer and product. Pricing corridor analysis is one of the most useful visualisations for pricing intelligence and analytics.
You can build your price corridor by selecting the customers buying the product you want to analyse and the average prices they pay compared to a price list. Once a familiar pattern emerges, you can act upon those situations outside of your price corridor.
Contact us today to learn how Qymatix’s pricing analytics software can make your sales more efficient, productive and profitable.
Free eBook for download: How To Get Started With Predictive Sales Analytics – Methods, data and practical ideas
Predictive analytics is the technology that enables a look into the future. What data do you need? How do you get started with predictive analytics? What methods can you use?
Download the free eBook now.
- We will use this data only to contact you for discussing predictive sales KPIs. You can read here our declaration on data protection.

Further Read:
Hermann Simon. Confessions of the Pricing Man: How Price Affects Everything.
Also interesting about pricing analytics:
B2B Dynamic Pricing – What Is It and How Can You Implement It In Your Company using Software

